- Published on
Python basic data visualization

#Related Topics:
Load Packages
python
import numpy as npimport pandas as pdimport matplotlib.pyplot as pltimport seaborn as sns; sns.set(style='white', color_codes=True)%matplotlib inlineimport warningswarnings.filterwarnings('ignore')
Import csv from Local Machine
python
df=pd.read_csv('gapminder.csv')#df=pd.read_csv('c:\\Users\\faisal\\Desktop\\Python\\Lesson-2\\gapminder.csv')#df=pd.read_csv(r'c:\Users\faisal\Desktop\Python\Lesson-2\gapminder.csv')
python
df.head()
country year infant_mortality life_expectancy fertility \0 Albania 1960 115.40 62.87 6.191 Algeria 1960 148.20 47.50 7.652 Angola 1960 208.00 35.98 7.323 Antigua and Barbuda 1960 NaN 62.97 4.434 Argentina 1960 59.87 65.39 3.11population gdp continent region0 1636054.0 NaN Europe Southern Europe1 11124892.0 1.382815e+10 Africa Northern Africa2 5270844.0 NaN Africa Middle Africa3 54681.0 NaN Americas Caribbean4 20619075.0 1.083220e+11 Americas South America
python
df.info()
text
<class 'pandas.core.frame.DataFrame'>RangeIndex: 10545 entries, 0 to 10544Data columns (total 9 columns):country 10545 non-null objectyear 10545 non-null int64infant_mortality 9092 non-null float64life_expectancy 10545 non-null float64fertility 10358 non-null float64population 10360 non-null float64gdp 7573 non-null float64continent 10545 non-null objectregion 10545 non-null objectdtypes: float64(5), int64(1), object(3)memory usage: 741.5+ KB
python
df['country']=df.country.astype('category')df['continent']=df.continent.astype('category')df['region']=df.region.astype('category')
python
df.info()
text
<class 'pandas.core.frame.DataFrame'>RangeIndex: 10545 entries, 0 to 10544Data columns (total 9 columns):country 10545 non-null categoryyear 10545 non-null int64infant_mortality 9092 non-null float64life_expectancy 10545 non-null float64fertility 10358 non-null float64population 10360 non-null float64gdp 7573 non-null float64continent 10545 non-null categoryregion 10545 non-null categorydtypes: category(3), float64(5), int64(1)memory usage: 543.0 KB
python
#Distributiond = sns.distplot(df['life_expectancy'])
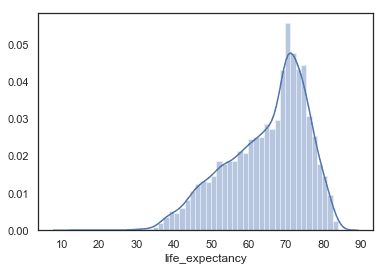
python
d = sns.distplot(df['life_expectancy'],bins=10)
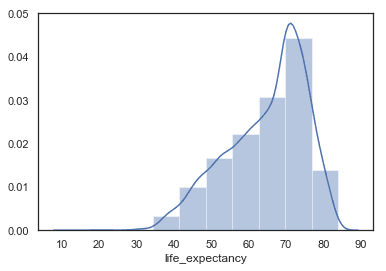
python
#Scatterplot:#plt.figure(figsize=(10,7)) # if you want to resize your plotdf2=df[df.year == 1962] # Filter the dataset only for specific years=sns.scatterplot( data=df2,x='fertility',y='life_expectancy',hue='continent', #color based on continent)plt.legend(bbox_to_anchor=(1.04,1), loc="upper left") # legend Positionplt.ylabel("Life Expentency") # y labelplt.xlabel("Fertility") # x label
text
Text(0.5, 0, 'Fertility')

python
#Linear Model plot:df2=df[df.year == 1962] # Filter the dataset only for specific yearl=sns.lmplot(data=df2,x='fertility',y='life_expectancy',size=7,aspect=1,scatter_kws={"s":100})plt.ylabel("Life Expentency") # y labelplt.xlabel("Fertility") # x label
text
Text(0.5, 8.96000000000003, 'Fertility')

python
#Boxplot:plt.figure(figsize=(10,7)) # if you want to resize your plotbp = sns.boxplot(data=df, x='continent', y= 'life_expectancy')
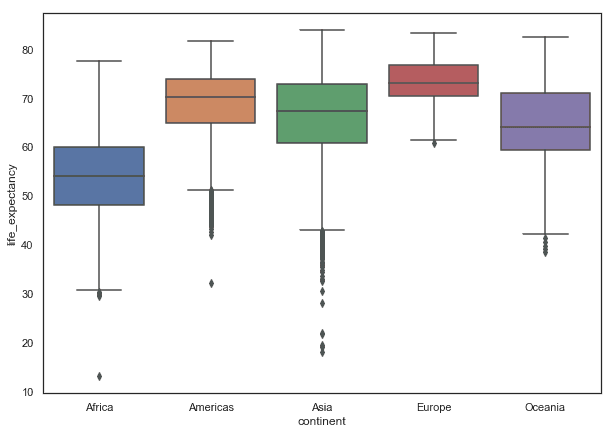
python
#jointplot:df2=df[df.year == 1962] # Filter the dataset only for specific yearj = sns.jointplot(data=df2, x='fertility',y='life_expectancy', color='g')

python
j = sns.jointplot(data=df2, x='fertility',y='life_expectancy', color='g', kind='reg')
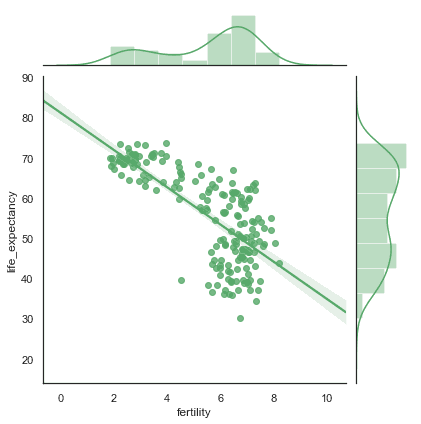
python
j = sns.jointplot(data=df2, x='fertility',y='life_expectancy', color='g', kind='hex')sns.set(style='white', color_codes=True)
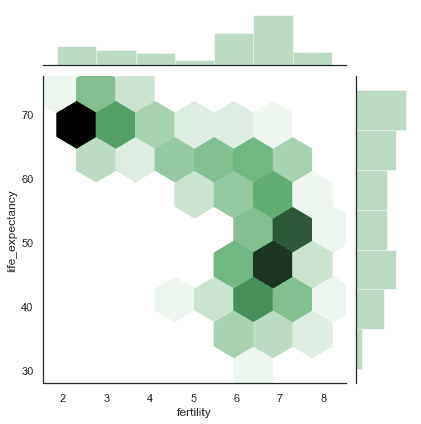
python
#histogramplt.hist(df['life_expectancy'], bins=5)
text
(array([ 6., 264., 1984., 3936., 4355.]),array([13.2 , 27.34, 41.48, 55.62, 69.76, 83.9 ]),<a list of 5 Patch objects>)
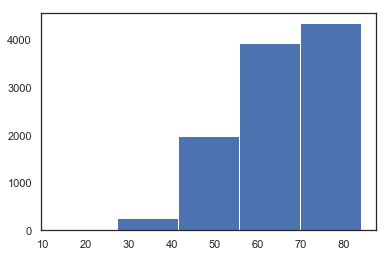
python
df.continent.cat.categories
Index(['Africa', 'Americas', 'Asia', 'Europe', 'Oceania'], dtype='object')
python
df.continent.unique() #SELECT DISTINCT COLUMN_NAME FROM TABLE
text
[Europe, Africa, Americas, Asia, Oceania]Categories (5, object): [Europe, Africa, Americas, Asia, Oceania]
python
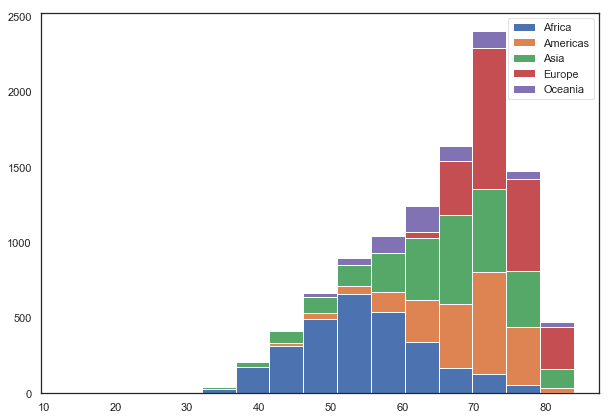
#Stacked Histogramplt.figure(figsize=(10,7))plt.hist([df[df.continent=='Africa'].life_expectancy,df[df.continent=='Americas'].life_expectancy,df[df.continent=='Asia'].life_expectancy,df[df.continent=='Europe'].life_expectancy,df[df.continent=='Oceania'].life_expectancy],bins=15,label=['Africa', 'Americas', 'Asia', 'Europe', 'Oceania'],stacked=True)plt.legend()plt.show()
