- Published on
Python correlation and regression

#Related Topics:
The Boston Housing Dataset
The Boston Housing Dataset is a derived from information collected by the U.S. Census Service concerning housing in the area of Boston MA. The following describes the dataset columns:
- CRIM - per capita crime rate by town
- ZN - proportion of residential land zoned for lots over 25,000 sq.ft.
- INDUS - proportion of non-retail business acres per town.
- CHAS - Charles River dummy variable (1 if tract bounds river; 0 otherwise)
- NOX - nitric oxides concentration (parts per 10 million)
- RM - average number of rooms per dwelling
- AGE - proportion of owner-occupied units built prior to 1940
- DIS - weighted distances to five Boston employment centres
- RAD - index of accessibility to radial highways
- TAX - full-value property-tax rate per $10,000
- PTRATIO - pupil-teacher ratio by town
- B - 1000(Bk - 0.63)^2 where Bk is the proportion of blacks by town
- LSTAT - % lower status of the population
- MEDV - Median value of owner-occupied homes in $1000's
Load Packages
python
import numpy as npimport pandas as pdimport matplotlib.pyplot as pltimport seaborn as sns; sns.set(style='white', color_codes=True)%matplotlib inlineimport warningswarnings.filterwarnings('ignore')
Import csv from Local Machine
python
names = ['CRIM', 'ZN', 'INDUS', 'CHAS', 'NOX', 'RM', 'AGE', 'DIS', 'RAD', 'TAX', 'PTRATIO', 'B', 'LSTAT', 'MEDV']df=pd.read_csv('housing.csv', delim_whitespace=True,names=names)
python
df.head()
CRIM ZN INDUS CHAS NOX RM AGE DIS RAD TAX \0 0.00632 18.0 2.31 0 0.538 6.575 65.2 4.0900 1 296.01 0.02731 0.0 7.07 0 0.469 6.421 78.9 4.9671 2 242.02 0.02729 0.0 7.07 0 0.469 7.185 61.1 4.9671 2 242.03 0.03237 0.0 2.18 0 0.458 6.998 45.8 6.0622 3 222.04 0.06905 0.0 2.18 0 0.458 7.147 54.2 6.0622 3 222.0PTRATIO B LSTAT MEDV0 15.3 396.90 4.98 24.01 17.8 396.90 9.14 21.62 17.8 392.83 4.03 34.73 18.7 394.63 2.94 33.44 18.7 396.90 5.33 36.2
Basic Information
python
df.shape
text
(506, 14)
python
df.info()
text
<class 'pandas.core.frame.DataFrame'>RangeIndex: 506 entries, 0 to 505Data columns (total 14 columns):# Column Non-Null Count Dtype--- ------ -------------- -----0 CRIM 506 non-null float641 ZN 506 non-null float642 INDUS 506 non-null float643 CHAS 506 non-null int644 NOX 506 non-null float645 RM 506 non-null float646 AGE 506 non-null float647 DIS 506 non-null float648 RAD 506 non-null int649 TAX 506 non-null float6410 PTRATIO 506 non-null float6411 B 506 non-null float6412 LSTAT 506 non-null float6413 MEDV 506 non-null float64dtypes: float64(12), int64(2)memory usage: 55.5 KB
python
df.describe()
text
CRIM ZN INDUS CHAS NOX RM \count 506.000000 506.000000 506.000000 506.000000 506.000000 506.000000mean 3.613524 11.363636 11.136779 0.069170 0.554695 6.284634std 8.601545 23.322453 6.860353 0.253994 0.115878 0.702617min 0.006320 0.000000 0.460000 0.000000 0.385000 3.56100025% 0.082045 0.000000 5.190000 0.000000 0.449000 5.88550050% 0.256510 0.000000 9.690000 0.000000 0.538000 6.20850075% 3.677082 12.500000 18.100000 0.000000 0.624000 6.623500max 88.976200 100.000000 27.740000 1.000000 0.871000 8.780000AGE DIS RAD TAX PTRATIO B \count 506.000000 506.000000 506.000000 506.000000 506.000000 506.000000mean 68.574901 3.795043 9.549407 408.237154 18.455534 356.674032std 28.148861 2.105710 8.707259 168.537116 2.164946 91.294864min 2.900000 1.129600 1.000000 187.000000 12.600000 0.32000025% 45.025000 2.100175 4.000000 279.000000 17.400000 375.37750050% 77.500000 3.207450 5.000000 330.000000 19.050000 391.44000075% 94.075000 5.188425 24.000000 666.000000 20.200000 396.225000max 100.000000 12.126500 24.000000 711.000000 22.000000 396.900000LSTAT MEDVcount 506.000000 506.000000mean 12.653063 22.532806std 7.141062 9.197104min 1.730000 5.00000025% 6.950000 17.02500050% 11.360000 21.20000075% 16.955000 25.000000max 37.970000 50.000000
python
#df.isna() #will return True or False for each value, if null then True, if not null then Falsedf.isna().sum() #will return total number of null for each column
text
CRIM 0ZN 0INDUS 0CHAS 0NOX 0RM 0AGE 0DIS 0RAD 0TAX 0PTRATIO 0B 0LSTAT 0MEDV 0dtype: int64
Exploratory Data Analysis
python
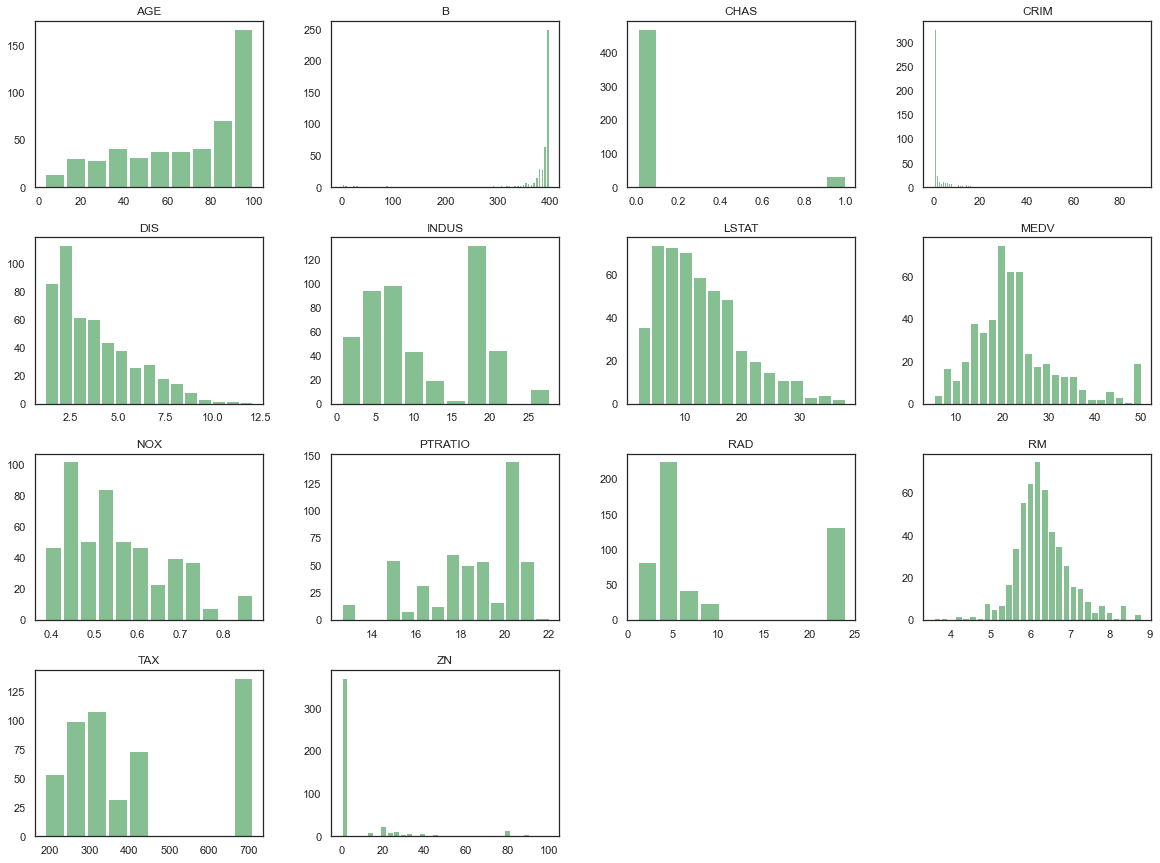
df.hist(bins='auto', grid=False, figsize=(20,15), color='#86bf91', zorder=2, rwidth=0.9)plt.show()
python
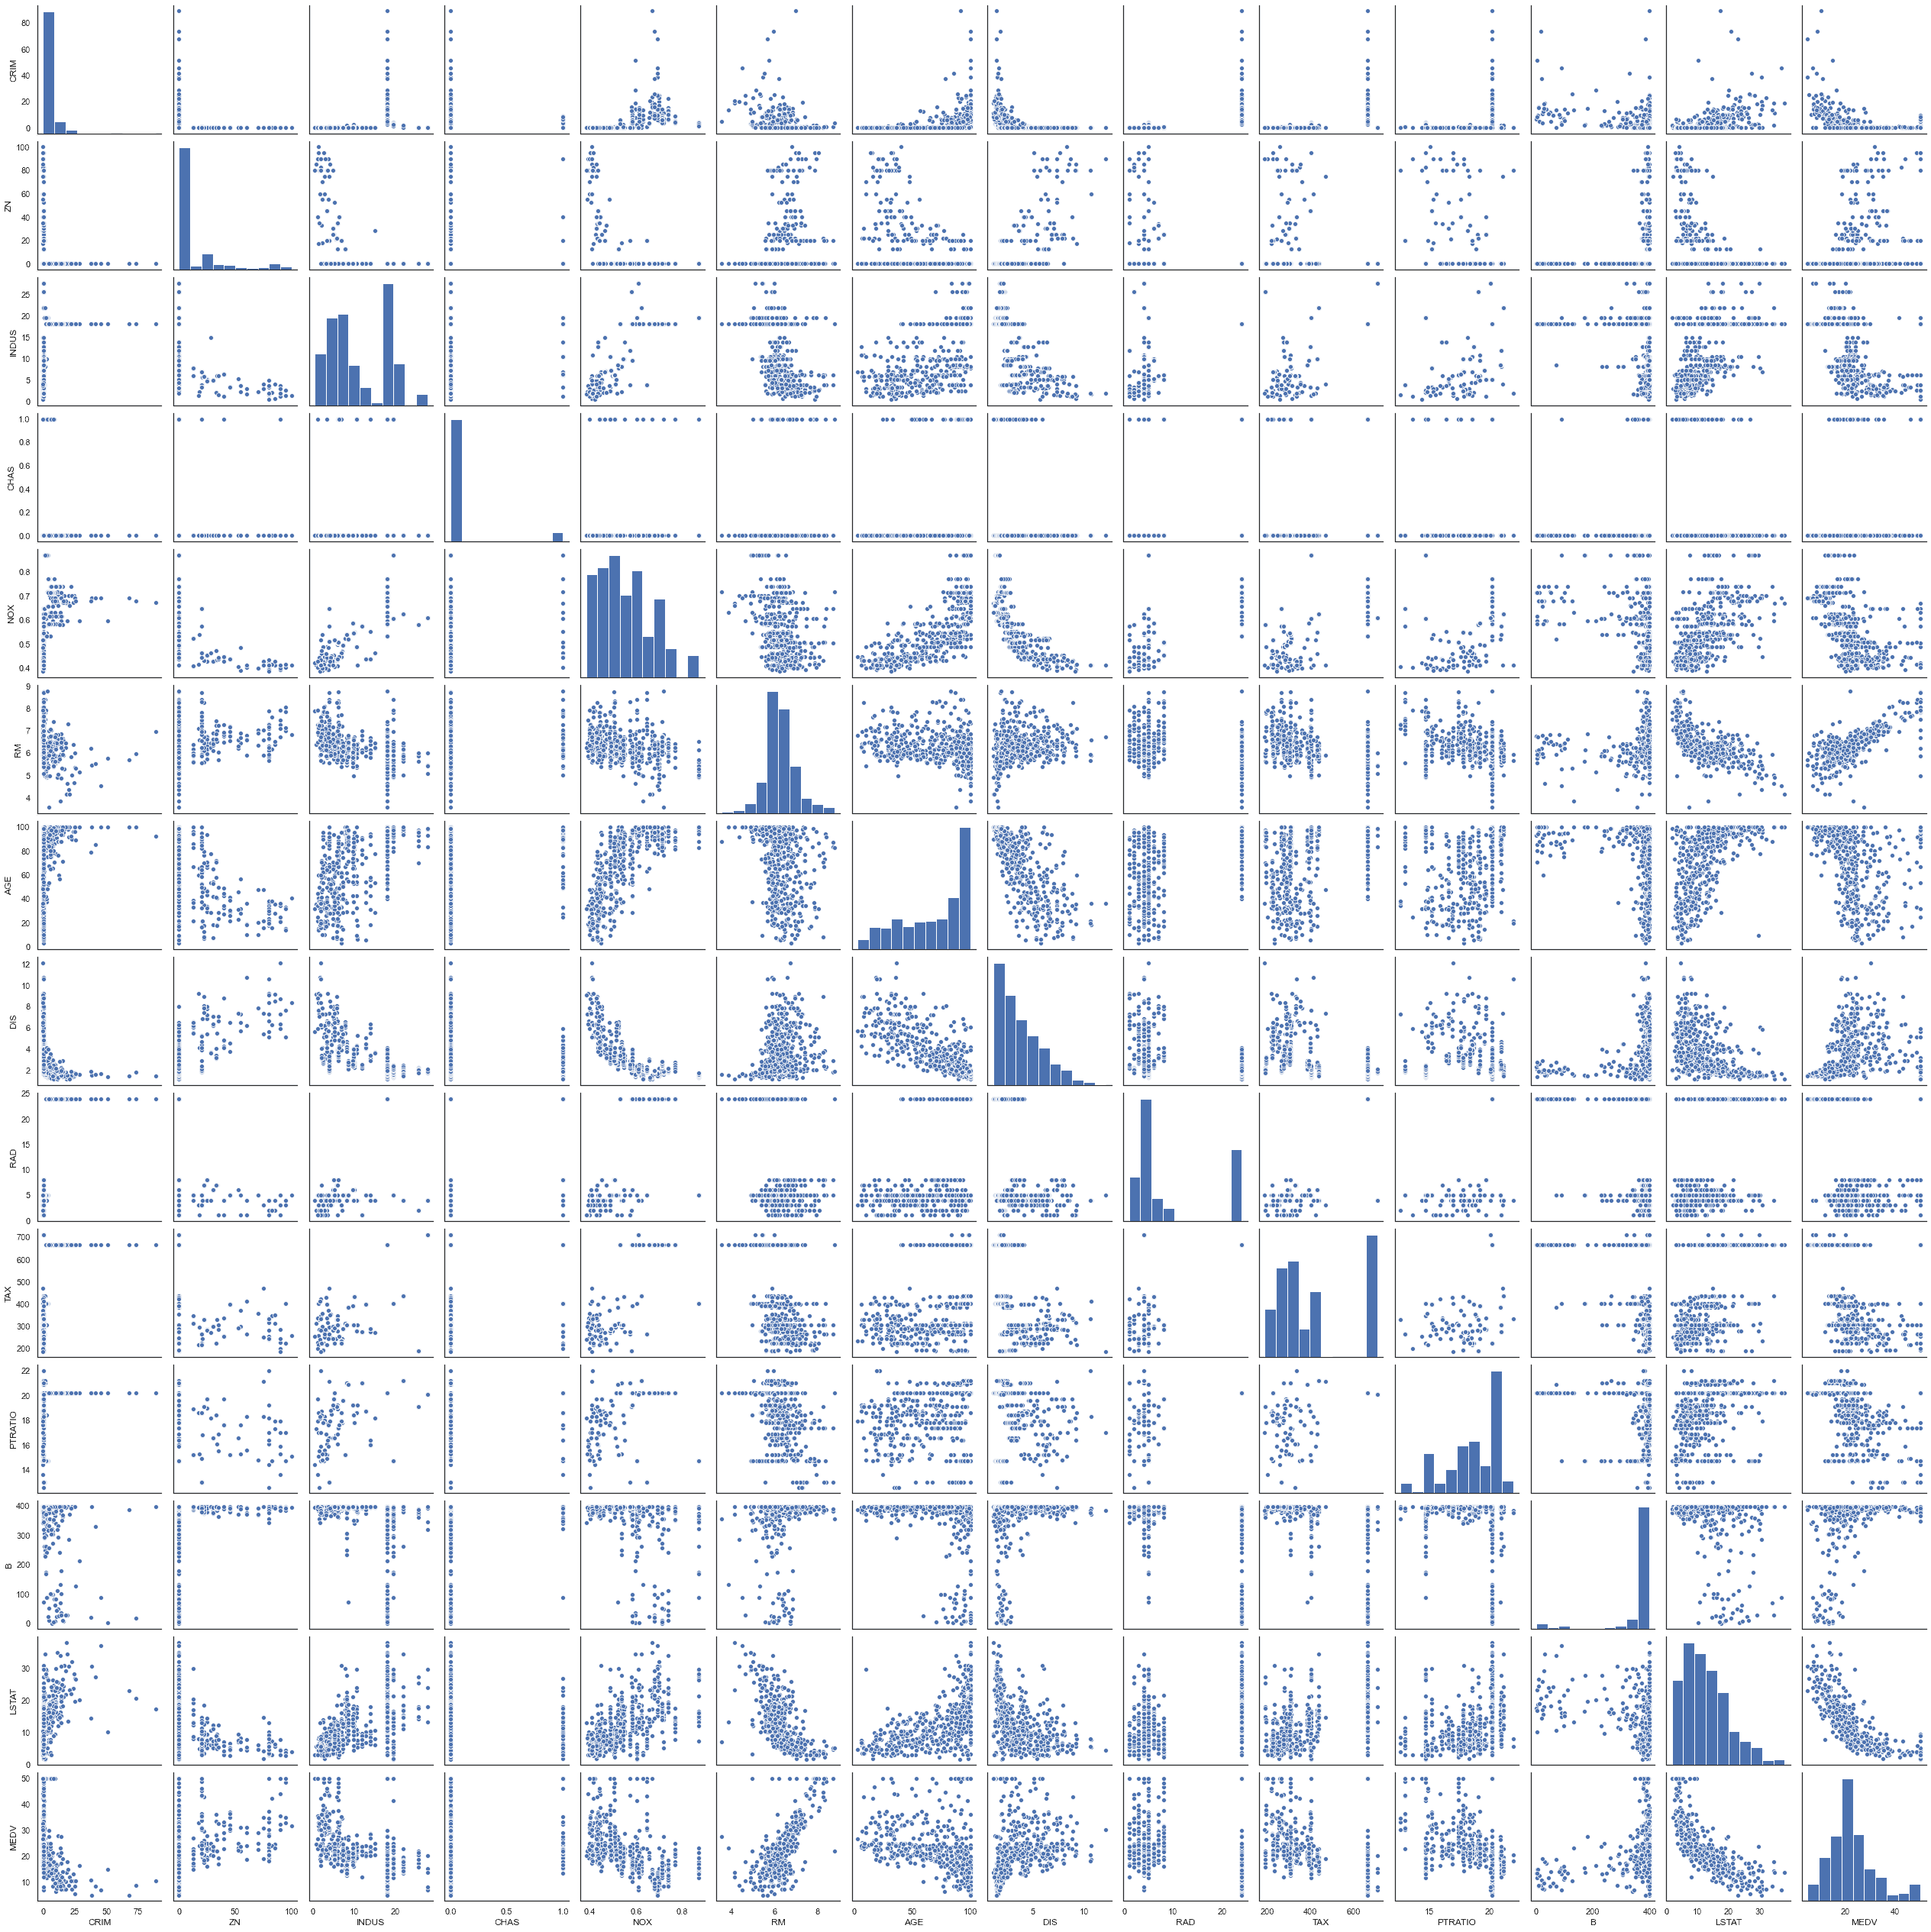
sns.pairplot(df)
text
<seaborn.axisgrid.PairGrid at 0x1c389a3ed60>
python
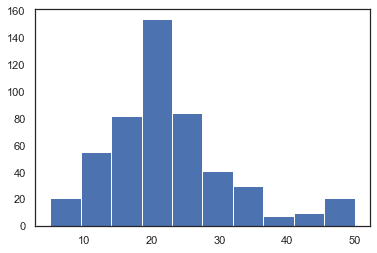
plt.hist(df['MEDV'])plt.show()
python
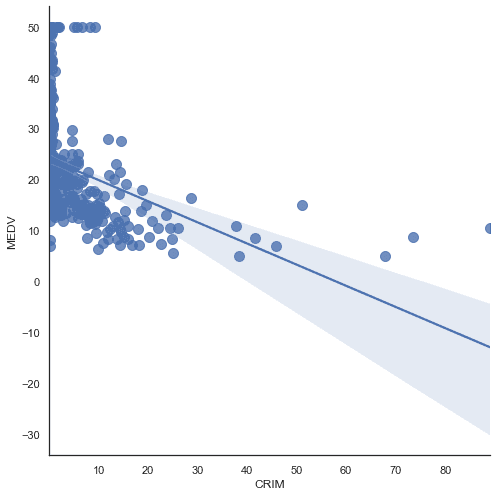
l=sns.lmplot(data=df,x='CRIM',y='MEDV',size=7,aspect=1,scatter_kws={"s":100})
Correlation
python
df.corr()
text
CRIM ZN INDUS CHAS NOX RM AGE \CRIM 1.000000 -0.200469 0.406583 -0.055892 0.420972 -0.219247 0.352734ZN -0.200469 1.000000 -0.533828 -0.042697 -0.516604 0.311991 -0.569537INDUS 0.406583 -0.533828 1.000000 0.062938 0.763651 -0.391676 0.644779CHAS -0.055892 -0.042697 0.062938 1.000000 0.091203 0.091251 0.086518NOX 0.420972 -0.516604 0.763651 0.091203 1.000000 -0.302188 0.731470RM -0.219247 0.311991 -0.391676 0.091251 -0.302188 1.000000 -0.240265AGE 0.352734 -0.569537 0.644779 0.086518 0.731470 -0.240265 1.000000DIS -0.379670 0.664408 -0.708027 -0.099176 -0.769230 0.205246 -0.747881RAD 0.625505 -0.311948 0.595129 -0.007368 0.611441 -0.209847 0.456022TAX 0.582764 -0.314563 0.720760 -0.035587 0.668023 -0.292048 0.506456PTRATIO 0.289946 -0.391679 0.383248 -0.121515 0.188933 -0.355501 0.261515B -0.385064 0.175520 -0.356977 0.048788 -0.380051 0.128069 -0.273534LSTAT 0.455621 -0.412995 0.603800 -0.053929 0.590879 -0.613808 0.602339MEDV -0.388305 0.360445 -0.483725 0.175260 -0.427321 0.695360 -0.376955DIS RAD TAX PTRATIO B LSTAT MEDVCRIM -0.379670 0.625505 0.582764 0.289946 -0.385064 0.455621 -0.388305ZN 0.664408 -0.311948 -0.314563 -0.391679 0.175520 -0.412995 0.360445INDUS -0.708027 0.595129 0.720760 0.383248 -0.356977 0.603800 -0.483725CHAS -0.099176 -0.007368 -0.035587 -0.121515 0.048788 -0.053929 0.175260NOX -0.769230 0.611441 0.668023 0.188933 -0.380051 0.590879 -0.427321RM 0.205246 -0.209847 -0.292048 -0.355501 0.128069 -0.613808 0.695360AGE -0.747881 0.456022 0.506456 0.261515 -0.273534 0.602339 -0.376955DIS 1.000000 -0.494588 -0.534432 -0.232471 0.291512 -0.496996 0.249929RAD -0.494588 1.000000 0.910228 0.464741 -0.444413 0.488676 -0.381626TAX -0.534432 0.910228 1.000000 0.460853 -0.441808 0.543993 -0.468536PTRATIO -0.232471 0.464741 0.460853 1.000000 -0.177383 0.374044 -0.507787B 0.291512 -0.444413 -0.441808 -0.177383 1.000000 -0.366087 0.333461LSTAT -0.496996 0.488676 0.543993 0.374044 -0.366087 1.000000 -0.737663MEDV 0.249929 -0.381626 -0.468536 -0.507787 0.333461 -0.737663 1.000000
python
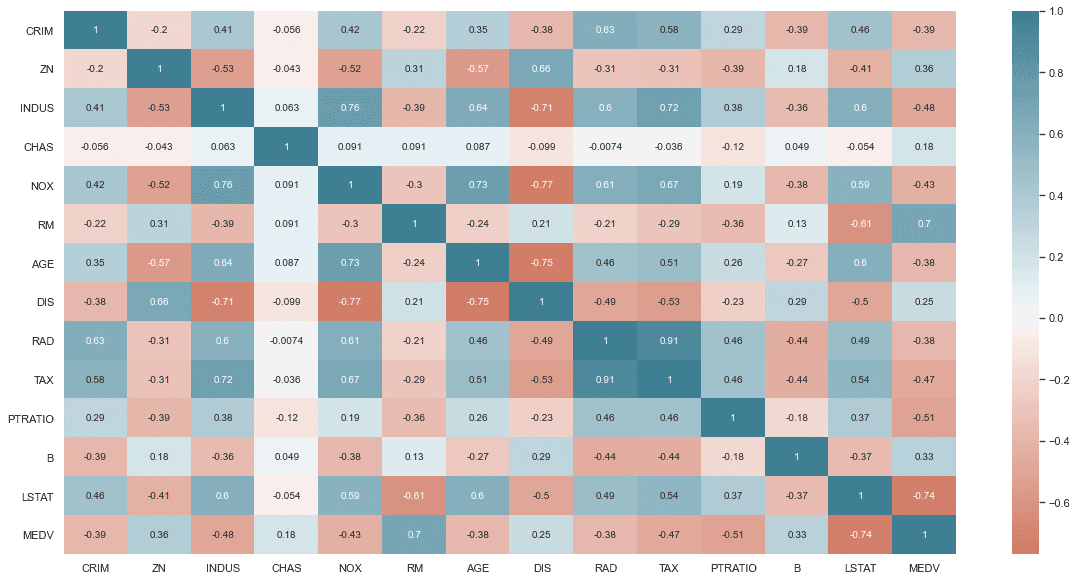
plt.figure(figsize=(20, 10))sns.heatmap(df.corr(),annot=True,center=0, cmap=sns.diverging_palette(20, 220, n=256, as_cmap=True) #Gradient color (optional))
text
<matplotlib.axes._subplots.AxesSubplot at 0x1c391c76d00>
Linear Regression Model
Linear Regression using Statsmodels
python
import statsmodels.api as smfrom statsmodels.graphics.gofplots import ProbPlot
python
df.columns
text
Index(['CRIM', 'ZN', 'INDUS', 'CHAS', 'NOX', 'RM', 'AGE', 'DIS', 'RAD', 'TAX','PTRATIO', 'B', 'LSTAT', 'MEDV'],dtype='object')
python
#Multiple linear regression (Select single variable for simple linear regression)X = df[['CRIM', 'ZN', 'INDUS', 'CHAS', 'NOX', 'RM', 'AGE', 'DIS', 'RAD', 'TAX','PTRATIO', 'B', 'LSTAT']]#x = df.loc[:, df.columns != 'MEDV'] #Same as above but more convenient#X = df[['CRIM', 'ZN']] #Omit insignificant variabley = df['MEDV'] #Target or dependend Variable
python
X = sm.add_constant(X) #intercept
python
model = sm.OLS(y, X).fit() #Ordinary least Square #trained model
python
predictions = model.predict(X)#predictions
python
model.summary()
text
<class 'statsmodels.iolib.summary.Summary'>"""OLS Regression Results==============================================================================Dep. Variable: MEDV R-squared: 0.741Model: OLS Adj. R-squared: 0.734Method: Least Squares F-statistic: 108.1Date: Wed, 02 Dec 2020 Prob (F-statistic): 6.72e-135Time: 12:46:46 Log-Likelihood: -1498.8No. Observations: 506 AIC: 3026.Df Residuals: 492 BIC: 3085.Df Model: 13Covariance Type: nonrobust==============================================================================coef std err t ----------------------------------const 36.4595 5.103 7.144 0.000 26.432 46.487CRIM -0.1080 0.033 -3.287 P>|t| [0.025 0.975]-------------------------------------------- 0.001 -0.173 -0.043ZN 0.0464 0.014 3.382 0.001 0.019 0.073INDUS 0.0206 0.061 0.334 0.738 -0.100 0.141CHAS 2.6867 0.862 3.118 0.002 0.994 4.380NOX -17.7666 3.820 -4.651 0.000 -25.272 -10.262RM 3.8099 0.418 9.116 0.000 2.989 4.631AGE 0.0007 0.013 0.052 0.958 -0.025 0.027DIS -1.4756 0.199 -7.398 0.000 -1.867 -1.084RAD 0.3060 0.066 4.613 0.000 0.176 0.436TAX -0.0123 0.004 -3.280 0.001 -0.020 -0.005PTRATIO -0.9527 0.131 -7.283 0.000 -1.210 -0.696B 0.0093 0.003 3.467 0.001 0.004 0.015LSTAT -0.5248 0.051 -10.347 0.000 -0.624 -0.425==============================================================================Omnibus: 178.041 Durbin-Watson: 1.078Prob(Omnibus): 0.000 Jarque-Bera (JB): 783.126Skew: 1.521 Prob(JB): 8.84e-171Kurtosis: 8.281 Cond. No. 1.51e+04==============================================================================Warnings:[1] Standard Errors assume that the covariance matrix of the errors is correctly specified.[2] The condition number is large, 1.51e+04. This might indicate that there arestrong multicollinearity or other numerical problems."""
python
# print the coefficientsmodel.params
text
const 36.459488CRIM -0.108011ZN 0.046420INDUS 0.020559CHAS 2.686734NOX -17.766611RM 3.809865AGE 0.000692DIS -1.475567RAD 0.306049TAX -0.012335PTRATIO -0.952747B 0.009312LSTAT -0.524758dtype: float64
python
model.pvalues
text
const 3.283438e-12CRIM 1.086810e-03ZN 7.781097e-04INDUS 7.382881e-01CHAS 1.925030e-03NOX 4.245644e-06RM 1.979441e-18AGE 9.582293e-01DIS 6.013491e-13RAD 5.070529e-06TAX 1.111637e-03PTRATIO 1.308835e-12B 5.728592e-04LSTAT 7.776912e-23dtype: float64
python
model.rsquared
text
0.7406426641094094
python
model.conf_int()
text
0 1const 26.432226 46.486751CRIM -0.172584 -0.043438ZN 0.019449 0.073392INDUS -0.100268 0.141385CHAS 0.993904 4.379563NOX -25.271634 -10.261589RM 2.988727 4.631004AGE -0.025262 0.026647DIS -1.867455 -1.083679RAD 0.175692 0.436407TAX -0.019723 -0.004946PTRATIO -1.209795 -0.695699B 0.004034 0.014589LSTAT -0.624404 -0.425113
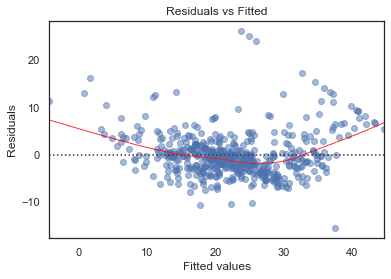
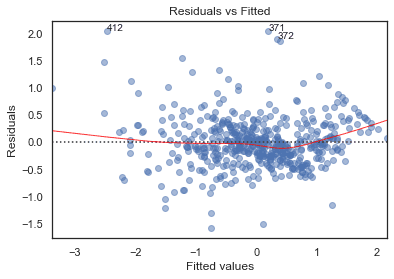
Residuals vs Fitted
python
# model valuesmodel_fitted_y = model.fittedvalues# model residualsmodel_residuals = model.resid# normalized residualsmodel_norm_residuals = model.get_influence().resid_studentized_internal# absolute squared normalized residualsmodel_norm_residuals_abs_sqrt = np.sqrt(np.abs(model_norm_residuals))# absolute residualsmodel_abs_resid = np.abs(model_residuals)# leverage, from statsmodels internalsmodel_leverage = model.get_influence().hat_matrix_diag# cook's distance, from statsmodels internalsmodel_cooks = model.get_influence().cooks_distance[0]plot_lm_1 = plt.figure()plot_lm_1.axes[0] = sns.residplot(model_fitted_y, df.columns[-1], data=df,lowess=True,scatter_kws={'alpha': 0.5},line_kws={'color': 'red', 'lw': 1, 'alpha': 0.8})plot_lm_1.axes[0].set_title('Residuals vs Fitted')plot_lm_1.axes[0].set_xlabel('Fitted values')plot_lm_1.axes[0].set_ylabel('Residuals');
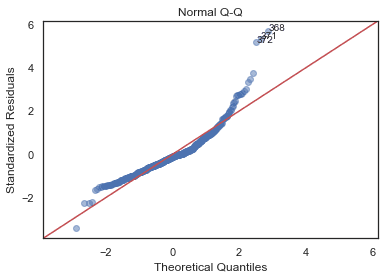
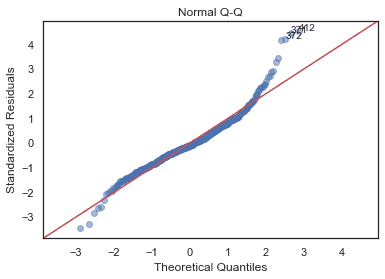
Normal Q-Q Plot
python
QQ = ProbPlot(model_norm_residuals)plot_lm_2 = QQ.qqplot(line='45', alpha=0.5, color='#4C72B0', lw=1)plot_lm_2.axes[0].set_title('Normal Q-Q')plot_lm_2.axes[0].set_xlabel('Theoretical Quantiles')plot_lm_2.axes[0].set_ylabel('Standardized Residuals');# annotationsabs_norm_resid = np.flip(np.argsort(np.abs(model_norm_residuals)), 0)abs_norm_resid_top_3 = abs_norm_resid[:3]for r, i in enumerate(abs_norm_resid_top_3):plot_lm_2.axes[0].annotate(i,xy=(np.flip(QQ.theoretical_quantiles, 0)[r],model_norm_residuals[i]));
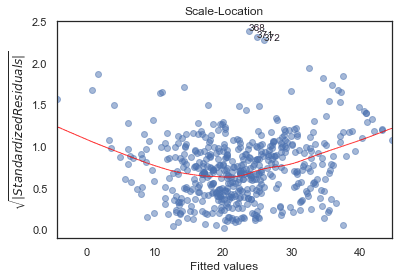
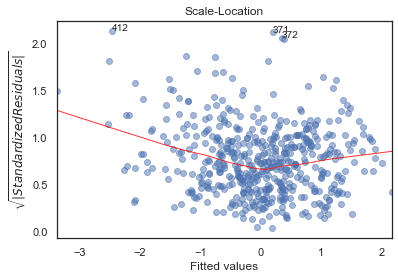
Scale-Location
python
plot_lm_3 = plt.figure()plt.scatter(model_fitted_y, model_norm_residuals_abs_sqrt, alpha=0.5);sns.regplot(model_fitted_y, model_norm_residuals_abs_sqrt,scatter=False,ci=False,lowess=True,line_kws={'color': 'red', 'lw': 1, 'alpha': 0.8});plot_lm_3.axes[0].set_title('Scale-Location')plot_lm_3.axes[0].set_xlabel('Fitted values')plot_lm_3.axes[0].set_ylabel('$\sqrt{|Standardized Residuals|}$');# annotationsabs_sq_norm_resid = np.flip(np.argsort(model_norm_residuals_abs_sqrt), 0)abs_sq_norm_resid_top_3 = abs_sq_norm_resid[:3]for i in abs_norm_resid_top_3:plot_lm_3.axes[0].annotate(i,xy=(model_fitted_y[i],model_norm_residuals_abs_sqrt[i]));
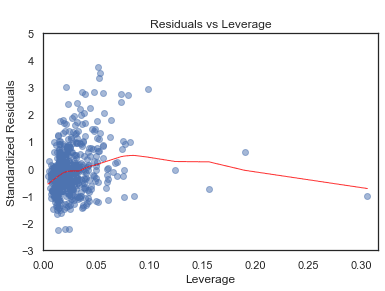
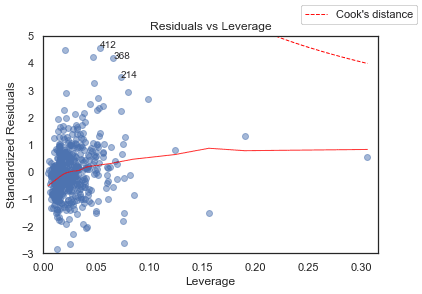
Residuals vs Leverage
python
plot_lm_4 = plt.figure();plt.scatter(model_leverage, model_norm_residuals, alpha=0.5);sns.regplot(model_leverage, model_norm_residuals,scatter=False,ci=False,lowess=True,line_kws={'color': 'red', 'lw': 1, 'alpha': 0.8});plot_lm_4.axes[0].set_xlim(0, max(model_leverage)+0.01)plot_lm_4.axes[0].set_ylim(-3, 5)plot_lm_4.axes[0].set_title('Residuals vs Leverage')plot_lm_4.axes[0].set_xlabel('Leverage')plot_lm_4.axes[0].set_ylabel('Standardized Residuals');# annotationsleverage_top_3 = np.flip(np.argsort(model_cooks), 0)[:3]for i in leverage_top_3:plot_lm_4.axes[0].annotate(i,xy=(model_leverage[i],model_norm_residuals[i]));
Box-Cox
python
from sklearn.preprocessing import PowerTransformerfrom sklearn.preprocessing import MinMaxScaler
python
df_scaled = df.copy()col_names= df.columnsfeatures = df_scaled[col_names]
python
scaler = MinMaxScaler(feature_range=(1,2))
python
df_scaled[col_names] = scaler.fit_transform(df)
python
power = PowerTransformer(method='box-cox')
python
df_scaled[col_names] = power.fit_transform(df_scaled.values)
python
df_scaled.hist(bins='auto', grid=False, figsize=(20,15), color='#86bf91', zorder=2, rwidth=0.9)plt.show()

python
x = df_scaled.loc[:, df_scaled.columns != 'MEDV']y = df_scaled['MEDV']
python
X = sm.add_constant(X)
python
model = sm.OLS(y, X).fit()
python
model.summary()
text
<class 'statsmodels.iolib.summary.Summary'>"""OLS Regression Results==============================================================================Dep. Variable: MEDV R-squared: 0.793Model: OLS Adj. R-squared: 0.788Method: Least Squares F-statistic: 145.3Date: Wed, 02 Dec 2020 Prob (F-statistic): 4.97e-159Time: 12:46:50 Log-Likelihood: -319.02No. Observations: 506 AIC: 666.0Df Residuals: 492 BIC: 725.2Df Model: 13Covariance Type: nonrobust==============================================================================coef std err t P>|t| [0.025 0.975]------------------------------------------------------------------------------const 2.5050 0.496 5.053 0.000 1.531 3.479CRIM -0.0209 0.003 -6.548 0.000 -0.027 -0.015ZN 0.0033 0.001 2.470 0.014 0.001 0.006INDUS 0.0046 0.006 0.774 0.439 -0.007 0.016CHAS 0.2546 0.084 3.042 0.002 0.090 0.419NOX -1.9704 0.371 -5.310 0.000 -2.699 -1.241RM 0.2601 0.041 6.406 0.000 0.180 0.340AGE 1.107e-05 0.001 0.009 0.993 -0.003 0.003DIS -0.1316 0.019 -6.790 0.000 -0.170 -0.093RAD 0.0347 0.006 5.383 0.000 0.022 0.047TAX -0.0015 0.000 -4.141 0.000 -0.002 -0.001PTRATIO -0.0980 0.013 -7.713 0.000 -0.123 -0.073B 0.0011 0.000 4.140 0.000 0.001 0.002LSTAT -0.0687 0.005 -13.938 0.000 -0.078 -0.059==============================================================================Omnibus: 81.337 Durbin-Watson: 1.096Prob(Omnibus): 0.000 Jarque-Bera (JB): 237.285Skew: 0.765 Prob(JB): 2.98e-52Kurtosis: 5.986 Cond. No. 1.51e+04==============================================================================Warnings:[1] Standard Errors assume that the covariance matrix of the errors is correctly specified.[2] The condition number is large, 1.51e+04. This might indicate that there arestrong multicollinearity or other numerical problems."""
python
def graph(formula, x_range, label=None):"""Helper function for plotting cook's distance lines"""x = x_rangey = formula(x)plt.plot(x, y, label=label, lw=1, ls='--', color='red')def diagnostic_plots(X, y, model_fit=None):"""Function to reproduce the 4 base plots of an OLS model in R.---Inputs:X: A numpy array or pandas dataframe of the features to use in building the linear regression modely: A numpy array or pandas series/dataframe of the target variable of the linear regression modelmodel_fit [optional]: a statsmodel.api.OLS model after regressing y on X. If not provided, will begenerated from X, y"""if not model_fit:model_fit = sm.OLS(y, sm.add_constant(X)).fit()# create dataframe from X, y for easier plot handlingdataframe = pd.concat([X, y], axis=1)# model valuesmodel_fitted_y = model_fit.fittedvalues# model residualsmodel_residuals = model_fit.resid# normalized residualsmodel_norm_residuals = model_fit.get_influence().resid_studentized_internal# absolute squared normalized residualsmodel_norm_residuals_abs_sqrt = np.sqrt(np.abs(model_norm_residuals))# absolute residualsmodel_abs_resid = np.abs(model_residuals)# leverage, from statsmodels internalsmodel_leverage = model_fit.get_influence().hat_matrix_diag# cook's distance, from statsmodels internalsmodel_cooks = model_fit.get_influence().cooks_distance[0]plot_lm_1 = plt.figure()plot_lm_1.axes[0] = sns.residplot(model_fitted_y, dataframe.columns[-1], data=dataframe,lowess=True,scatter_kws={'alpha': 0.5},line_kws={'color': 'red', 'lw': 1, 'alpha': 0.8})plot_lm_1.axes[0].set_title('Residuals vs Fitted')plot_lm_1.axes[0].set_xlabel('Fitted values')plot_lm_1.axes[0].set_ylabel('Residuals');# annotationsabs_resid = model_abs_resid.sort_values(ascending=False)abs_resid_top_3 = abs_resid[:3]for i in abs_resid_top_3.index:plot_lm_1.axes[0].annotate(i,xy=(model_fitted_y[i],model_residuals[i]));QQ = ProbPlot(model_norm_residuals)plot_lm_2 = QQ.qqplot(line='45', alpha=0.5, color='#4C72B0', lw=1)plot_lm_2.axes[0].set_title('Normal Q-Q')plot_lm_2.axes[0].set_xlabel('Theoretical Quantiles')plot_lm_2.axes[0].set_ylabel('Standardized Residuals');# annotationsabs_norm_resid = np.flip(np.argsort(np.abs(model_norm_residuals)), 0)abs_norm_resid_top_3 = abs_norm_resid[:3]for r, i in enumerate(abs_norm_resid_top_3):plot_lm_2.axes[0].annotate(i,xy=(np.flip(QQ.theoretical_quantiles, 0)[r],model_norm_residuals[i]));plot_lm_3 = plt.figure()plt.scatter(model_fitted_y, model_norm_residuals_abs_sqrt, alpha=0.5);sns.regplot(model_fitted_y, model_norm_residuals_abs_sqrt,scatter=False,ci=False,lowess=True,line_kws={'color': 'red', 'lw': 1, 'alpha': 0.8});plot_lm_3.axes[0].set_title('Scale-Location')plot_lm_3.axes[0].set_xlabel('Fitted values')plot_lm_3.axes[0].set_ylabel('$\sqrt{|Standardized Residuals|}$');# annotationsabs_sq_norm_resid = np.flip(np.argsort(model_norm_residuals_abs_sqrt), 0)abs_sq_norm_resid_top_3 = abs_sq_norm_resid[:3]for i in abs_norm_resid_top_3:plot_lm_3.axes[0].annotate(i,xy=(model_fitted_y[i],model_norm_residuals_abs_sqrt[i]));plot_lm_4 = plt.figure();plt.scatter(model_leverage, model_norm_residuals, alpha=0.5);sns.regplot(model_leverage, model_norm_residuals,scatter=False,ci=False,lowess=True,line_kws={'color': 'red', 'lw': 1, 'alpha': 0.8});plot_lm_4.axes[0].set_xlim(0, max(model_leverage)+0.01)plot_lm_4.axes[0].set_ylim(-3, 5)plot_lm_4.axes[0].set_title('Residuals vs Leverage')plot_lm_4.axes[0].set_xlabel('Leverage')plot_lm_4.axes[0].set_ylabel('Standardized Residuals');# annotationsleverage_top_3 = np.flip(np.argsort(model_cooks), 0)[:3]for i in leverage_top_3:plot_lm_4.axes[0].annotate(i,xy=(model_leverage[i],model_norm_residuals[i]));p = len(model_fit.params) # number of model parametersgraph(lambda x: np.sqrt((0.5 * p * (1 - x)) / x),np.linspace(0.001, max(model_leverage), 50),'Cook\'s distance') # 0.5 linegraph(lambda x: np.sqrt((1 * p * (1 - x)) / x),np.linspace(0.001, max(model_leverage), 50)) # 1 lineplot_lm_4.legend(loc='upper right');
python
diagnostic_plots(X, y)
Linear Regression using SKlearn:
python
from sklearn import linear_model
python
#Multiple linear regression (Select single variable for simple linear regression)X = df[['CRIM', 'ZN', 'INDUS', 'CHAS', 'NOX', 'RM', 'AGE', 'DIS', 'RAD', 'TAX','PTRATIO', 'B', 'LSTAT']]#x = df.loc[:, df.columns != 'MEDV'] #Same as above but more convenient#X = df[['CRIM', 'ZN']] #Omit insignificant variabley = df['MEDV'] #Target or dependend Variable
Split Train and Test Data
python
from sklearn.model_selection import train_test_split
python
X_train, X_test, y_train, y_test = train_test_split(X, y, test_size=0.4, random_state=101)
Creating and Training the Model:
python
from sklearn.linear_model import LinearRegression
python
lm = LinearRegression()
python
lm.fit(X_train,y_train) #trained model
text
LinearRegression()
Model Evaluation
python
lm.intercept_
text
41.28149654473732
python
lm.score(X_train,y_train)
text
0.7501501474315525
python
lm.coef_
text
array([-7.75583711e-02, 4.20310157e-02, 9.11529473e-02, 4.13304932e+00,-1.99765575e+01, 2.89019042e+00, 1.61533256e-02, -1.26474745e+00,2.60170760e-01, -1.11251993e-02, -8.80555502e-01, 7.02445445e-03,-6.43482813e-01])
python
X.columns
text
Index(['CRIM', 'ZN', 'INDUS', 'CHAS', 'NOX', 'RM', 'AGE', 'DIS', 'RAD', 'TAX','PTRATIO', 'B', 'LSTAT'],dtype='object')
python
coeff_df = pd.DataFrame(lm.coef_,X.columns,columns=['Coefficient'])coeff_df
text
CoefficientCRIM -0.077558ZN 0.042031INDUS 0.091153CHAS 4.133049NOX -19.976557RM 2.890190AGE 0.016153DIS -1.264747RAD 0.260171TAX -0.011125PTRATIO -0.880556B 0.007024LSTAT -0.643483
Predictions from trained Model
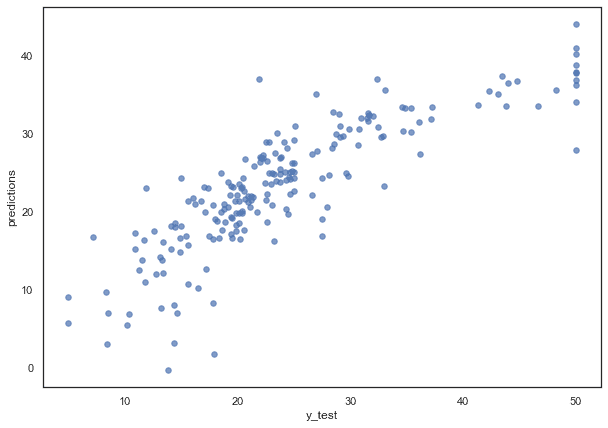
python
predictions = lm.predict(X_test)predictions
text
array([38.76995104, 27.39271318, 16.26805601, 16.64592872, 30.5945708 ,31.37975753, 37.68282481, 7.57986744, 33.62371472, 6.94206736,30.00015138, 13.74184077, 16.41357803, 17.5975484 , 24.92452314,20.61277162, 6.84027833, 32.74459645, 28.14176473, 24.87051184,12.01460369, 19.89597528, 22.93223855, 24.84808083, 33.41944923,18.2663553 , 32.40616206, 19.07263109, 27.85446156, 33.36724349,20.31071184, 18.71427039, 36.3942392 , 43.97914411, 28.53636198,22.23810379, 15.23341286, 18.4441601 , 2.99896469, 30.75373687,23.98495287, 17.65233987, 33.49269972, 13.72450288, 17.45026475,25.3864821 , 29.9370352 , 16.43822597, 27.0157306 , 23.23886475,31.8958797 , 36.8917952 , 22.96758436, 18.06656811, 30.34602124,-0.30828515, 19.8446382 , 16.6131071 , 23.63902347, 21.26225918,29.69766593, 3.14282554, 16.86387632, 19.76329036, 9.71050797,24.21870511, 24.27695942, 19.87071765, 17.16247142, 19.85216234,23.74078001, 21.56791537, 23.14099313, 20.54638573, 27.77053085,21.2590119 , 36.87579928, 8.05035628, 28.9146871 , 16.70037511,15.70980238, 19.14484394, 29.65683713, 16.86617546, 10.15073018,21.34814159, 21.81482232, 32.18098353, 22.24314075, 21.75449868,12.50117018, 10.64264803, 22.59103858, 32.00987194, 5.75604165,34.05952126, 7.04112579, 31.53788515, 9.02176123, 21.19511453,32.37147301, 21.32823602, 27.19438339, 24.91207186, 23.08174295,24.76969659, 24.77145042, 30.14032582, 36.63344929, 32.59298802,23.27852444, 35.5111093 , 24.17973314, 22.05040637, 29.57566524,26.94598149, 28.86934886, 30.98598123, 26.77898549, 28.83037557,16.05739187, 20.89220193, 21.91047939, 36.88601261, 25.01402328,23.53157107, 15.12274061, 5.50883218, 14.14631563, 23.87422049,26.85906918, 33.17708597, 24.22078613, 19.60743115, 24.54377589,26.24871922, 30.8997013 , 26.2619873 , 33.44890707, 23.05544279,12.12838356, 35.44082938, 31.79591619, 16.5997814 , 25.17956469,19.77417177, 20.07188943, 24.67905941, 26.64881616, 29.50609111,16.87246772, 16.25039628, 40.96167542, 36.18058639, 22.00214486,21.47973172, 23.48638653, 12.67663095, 20.83340172, 24.99555373,19.27796673, 29.13806185, 40.15324017, 22.1316772 , 26.14454982,23.02029457, 18.61562996, 30.48499643, 17.42381182, 10.92515821,18.66294924, 33.26084439, 34.96275041, 20.74820685, 1.70547647,18.03065088, 27.34915728, 18.06414053, 28.56520062, 24.41093319,27.53096541, 20.55435421, 22.62919622, 37.78233999, 26.87713512,37.38740447, 25.79142163, 14.81336505, 22.11034091, 17.09095927,25.08768209, 35.57385009, 8.21251303, 20.29558413, 19.03028948,26.45168363, 24.24592238, 18.52485619, 21.43469229, 35.01450733,20.96970996, 23.6978562 , 28.08966447])
python
plt.figure(figsize=(10,7)) # if you want to resize your plotplt.scatter(x=y_test,y=predictions, s=30, alpha=0.7)plt.ylabel("predictions")plt.xlabel("y_test")
text
Text(0.5, 0, 'y_test')
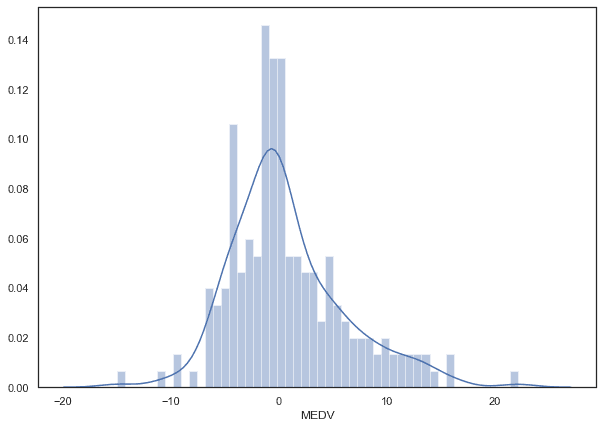
Residual Distribution
python
plt.figure(figsize=(10,7)) # if you want to resize your plot # residualsns.distplot((y_test-predictions),bins=50);
Plotting the Least Squares Line
python
#sns.pairplot(df, x_vars=['CRIM', 'ZN', 'INDUS', 'CHAS', 'NOX', 'RM', 'AGE', 'DIS', 'RAD', 'TAX',# 'PTRATIO', 'B', 'LSTAT'], y_vars='MEDV', size=7, aspect=0.7, kind='reg')
Regression Evaluation Metrics
python
from sklearn import metrics
Mean Absolute Error (MAE) Mean Squared Error (MSE) Root Mean Squared Error (RMSE)
python
print('MAE:', metrics.mean_absolute_error(y_test, predictions))print('MSE:', metrics.mean_squared_error(y_test, predictions))print('RMSE:', np.sqrt(metrics.mean_squared_error(y_test, predictions)))
text
MAE: 3.9051448026275173MSE: 29.416365467452877RMSE: 5.423685598138306