Browser and JavaScript Debug
This articles covers these topics how browser work, dom tree, render tree, alert, confirmation, prompt, url components, document location, history api, dev tools, cookies, local storage, session storage, javascript debug, basic cmd command
1 HOW BROWSER WORKS, BROWSER API AND METHODS
1.1 CONTENTEDITABLE, LIVE EDIT
// browser console
document.body.contentEditable = true; // website content will be editable
1.2 HOW BROWSER WORKS, DOM TREE, RENDER TREE
Resources - 1
Resources - 2
Resources - 3
Resources - 4
1.3 WEBSITE ALERT, CONFIRMATION, PROMPT TO COLLECT DATA
// browser console
// alert
alert("This is an alert"); // use case: warning, notification

// confirm
confirm("Are you coming in the picnic"); // take confirmation from user

// prompt
prompt("Tell me your name"); // take input from user1.4 URL, URL PARTS, QUERY STRING, HASH, SUBDOMAIN
URL: Uniform Resources Locator
example: https://reactjs.org/
URL Part:
example: https://reactjs.org/tutorial/tutorial.html
Query String:
example: https://www.youtube.com/watch?v=pQeFxdT3FGY&t=120s
Hash:
example: https://reactjs.org/tutorial/tutorial.html#what-is-react
SUbdomain:
example: support.wordpress.com
1.5 DOCUMENT LOCATION, ACCESS HREF, HASH, ASSIGN
// browser console
window.location;
// origin, protocol, host, hostname, hash, href, assign etc
location.reload(); // reload the location

location.assign("dsfaisal.com"); // assign url
location.href("dsfaisal.com"); // link to url1.6 HISTORY API, BACK, FORWARD, GO, HISTORY LENGTH
// browser console
// history
// history.back()
// history.forward()
// history.go(3)1.7 COOKIES, DEV TOOL APPLICATION TAB, COOKIES AT SERVER
// browser > inspect > Application > cookies1.8 LOCAL STORAGE, SESSION STORAGE, EDIT STORAGE INFORMATION
// browser > inspect > Application > Local Storage
// local storage or persistent storage, save in browser

// browser > inspect > Application > Session Storage
// stay until browser tab is closed

// browser console
// localStorage
// localStorage.setItem("isSubscribed", true);

// sessionStorage.setItem("isPlaying", true);1.9 BROWSER CLEAR CACHE, CHROME EXTENSION, WEB STORE, RESTART BROWSER
// browser > inspect
// Click and hold mouse right button on browser reload button icon and
// select "Empty and cache and hard reload"
2 JAVASCRIPT DEBUG, WEB DEBUG, DEV TOOL MASTERING
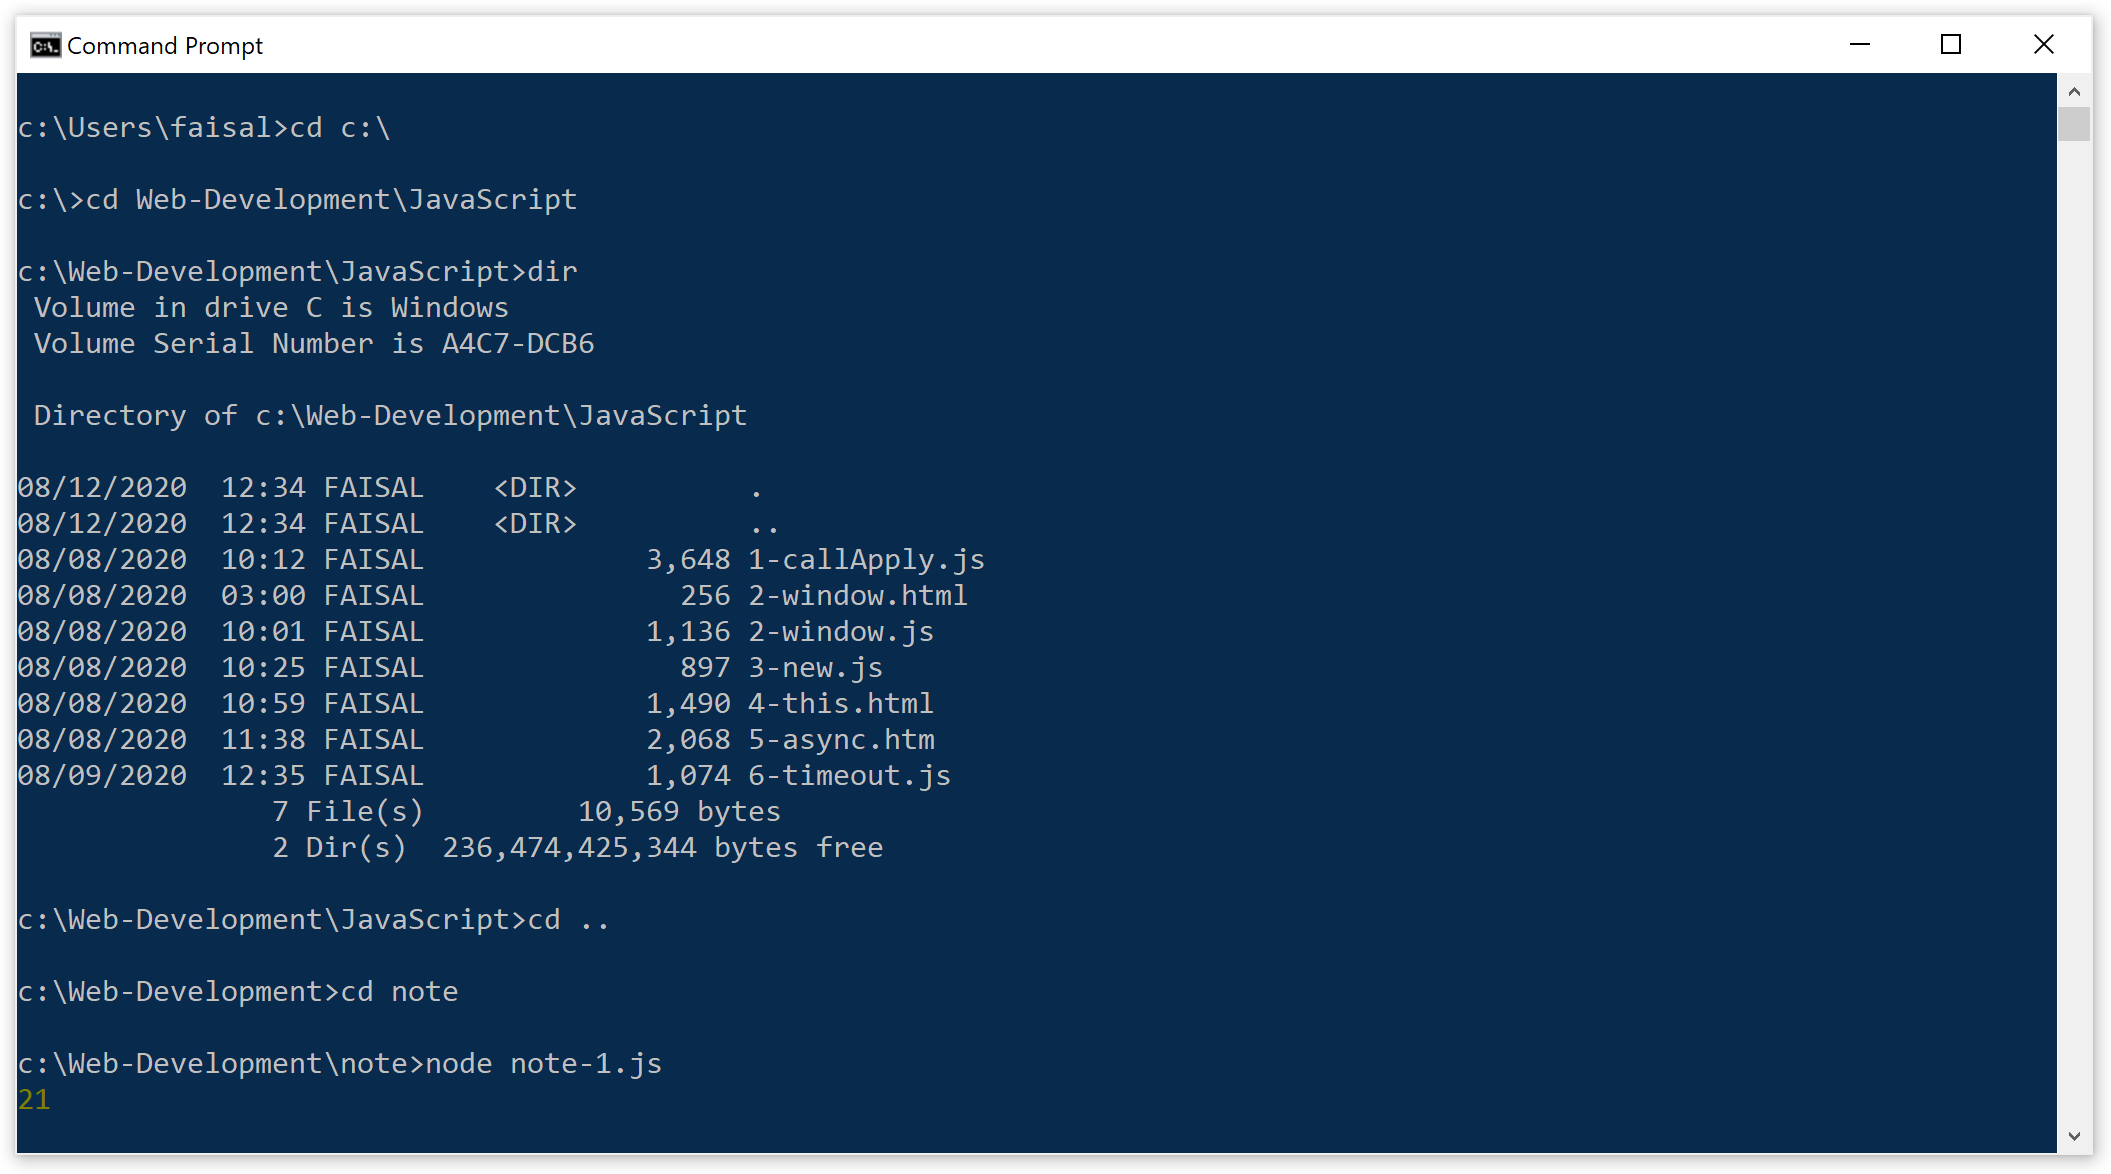
2.1 COMMAND LINE TOOLS


2.2 MODULE OVERVIEW, SALARY APP OVERVIEW, GIT CLONE ISSUES
Browser inspect > Click on Selector button
- Change/ add/ delete element text
- Add new class
- Copy > Copy Styles
- Break on
- ctrl + F to find element with class/ id
Click on Device toolbar button
- Set breakpoint
- Set device
- Online/ offline
- Show rulers
- Capture Screenshot
2.3 EDIT CSS STYLE LIVE, HOVER CLASS, CSS BOX MODEL, EVENT HANDLER
Browser > select element, Click on Styles
- Can find the source css file location with line number
- Own style + Parent Style
- Test style, use up/ down arrow to change px value:
element.style {margin-left: 20px; color: orange;} - Uncheck style
- .cls to check classes/ add classes
- :hov to check hover effect
- Filter- margin, color
Click on Computed
- Check final property
- Box model- change margin/ padding/ border/ width value to check
Click on Event Listener
- Check different JS handler
- Uncheck Framework listener to exclude library related handler
Click DOM Breakpoints
Click accessibility
- to help people with disability/ color blind
2.4 SOURCES TAB, BREAK POINT, CALL STACK, CONSOLE TABLE
Browser inspect > console
- check is there any error or not
Lets say if you don't have source code
Browser inspect > Sources
-
ctrl + F, use search to search specific element
-
ctrl+shift+o
-
Set Breakpoint, reload browser and check, call stack press Esc to open console example: data example: console.table(data[0].values)
-
Set breakpoint for local variable, add Watch, then check example: data[4]
-
ctrl+shift+F for search in all files
2.5 CONSOLE TAB, PRESERVE LOG, ERROR LOG, CONSOLE API
browser console,check errors, check all All Levels
2.6 NETWORK TAB, REQUEST METHOD, HEADER, RESPONSE TYPE
2.7 PERFORMANCE TAB, MEMORY TAB, AUDIT, APPLICATION TAB
Dev Tools Evaluate Performance
Dev Tools Memory
Audit - chrome lighthouse tool
Chrome Dev Tools
Dev Tools Tips
50 Dev tool tips and tricks
Last updated on
Notes
A curated collection of my personal study notes and technical insights, spanning JavaScript ES6+ deep dives, Python for data science, and practical React snippets. These notes are distilled from my continuous learning journey, serving as both a quick reference and a comprehensive knowledge base for modern web development.
JavaScript Basics Part- 1
The fundamental concepts of JavaScript